The electrocardiogram
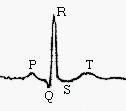 In the late 1800s Einthoven was one of potential during a heartbeat. These changes could be measured through the skin, and gave clues about the nature of heart problems or diseases. The differences in potential were small and difficult to measure, but Einthoven succeeded in mathematically deriving the shape of the electrocardiogram (ECG) from his records, and labeled the points which are still used to describe the wave today – P,Q,R,S and T.
Realising the importance of having an instrument that could measure these changes and record them directly, he created the string galvanometer. This was an extremely sensitive instrument which allowed the waveform generated by the heartbeat to be measured and recorded accurately.
ECGs recorded from all animals had the same characteristic waveform, and frogs and dogs were used to study the ways that changes to physiology – such as drugs which altered the heartbeat – affected the ECG. All diseases of the heart produce characteristic changes to the ECG, which were defined through many animal experiments. The ability to ‘see’ changes in the heart and recognise disease states immediately using the ECG was first used in hospitals in the early 1900s.
Last edited: 27 August 2014 05:48